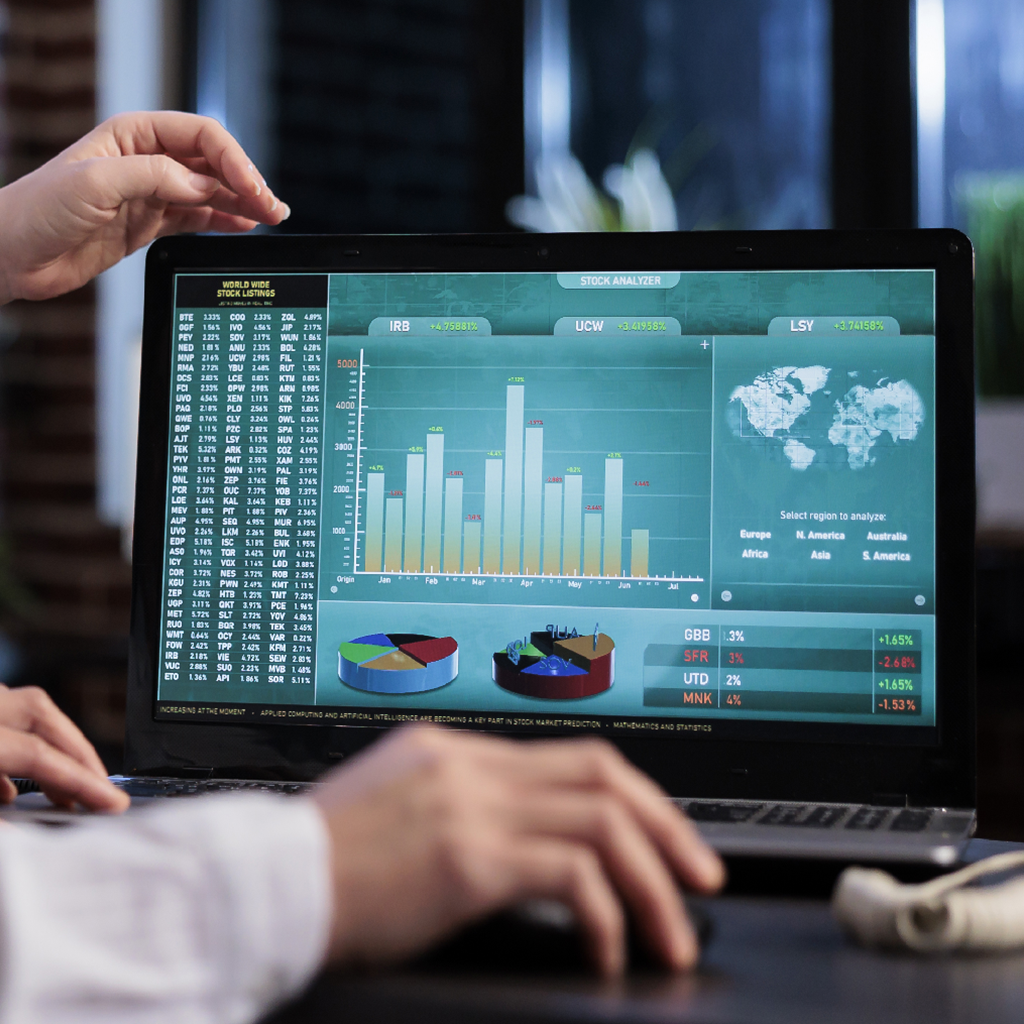
Drive Informed Actions
with Visualization
Infocion's Edge Visualization solutions empower you to see, understand,
and act on real-time data insights from your edge devices.

The Power of Edge Visualization
In today's data-driven world, the exponential growth of data generated at the network's edge - from industrial sensors to smart devices - presents a vast opportunity for real-time insights and operational optimization. However, the sheer volume and complexity of this data can be overwhelming. Traditional visualization tools often struggle to keep pace with the dynamic nature of edge data, hindering your ability to extract meaningful intelligence.
Infocion's Edge Visualization Solutions bridge this gap. We provide a powerful and user-friendly platform specifically designed to transform complex edge data into clear, interactive visualizations. This shift from raw data to visual representations empowers businesses to unlock the true potential of the edge, enabling them to make data-driven decisions and optimize operations in real-time.
Key Features
Real-Time & Historical Data Visualization
Gain a holistic view of your edge environment with customizable dashboards and visualizations presenting real-time and historical sensor data.
Contextual Insights
Visualize data alongside relevant context, such as sensor location, operational status, and historical trends, for a richer understanding of edge operations.
Interactive Exploration & Analysis
Leverage interactive dashboards to explore data deeper, filter information, and gain granular insights to optimize edge operations.
Remote Monitoring & Management
Monitor and manage edge deployments remotely through centralized visualization platforms. Gain real-time visibility into device health, performance, and potential issues, enabling proactive troubleshooting.
Benefits
Faster and More Informed Decisions
Visualize and analyze data at the edge, enabling quicker decision-making based on real-time insights without waiting for centralized data processing.
Improved Situational Awareness
Gain a comprehensive understanding of your edge environment through clear and concise visualizations, allowing for proactive identification of performance issues and potential risks.
Enhanced Collaboration
Facilitate better communication and collaboration between teams by sharing edge data insights through clear and accessible visualizations.
Streamlined Operations
Optimize resource allocation, identify areas for improvement, and ensure smooth operation of your edge deployments through data-driven insights derived from edge visualizations.
Use Cases
Finance - Real-time Fraud Detection Visualization
Visualize transaction data in real-time to identify suspicious activity patterns and enable immediate action against potential fraud attempts.
Example: A bank displays a real-time map of suspicious transaction attempts across various locations, allowing security personnel to identify and block fraudulent transactions immediately, minimizing financial losses.
Healthcare - Remote Patient Monitoring Dashboards
Visualize patient vital signs and health data collected through wearable devices on dashboards accessible to healthcare professionals, enabling remote monitoring and timely interventions.
Example: A diabetes management clinic utilizes Infocion's Remote Patient Monitoring Dashboards to remotely monitor patients with Type 2 diabetes. Patients wear comfortable smartwatches that continuously track blood sugar levels, heart rate, and activity levels. Edge analytics on the smartwatch filters and processes data, identifying trends and potential concerns. Real-time data visualizations on the dashboard display key metrics like blood sugar trends, activity levels, and sleep patterns.
Transportation & Logistics
Visualize real-time traffic data, vehicle location, and sensor data to optimize routes, improve delivery efficiency, and ensure driver safety.
Example: A logistics company displays the location of their delivery trucks on a map in real-time, allowing them to optimize delivery routes based on traffic conditions, minimize delivery times, and ensure driver safety.
Energy & Utilities - Smart Grid Visualization
Visualize real-time energy usage and demand data, consumption patterns, and grid conditions to optimize energy distribution, ensure grid stability, and reduce operational costs.
Example: A utility company displays real-time energy consumption data across its service area on a map, allowing them to identify peak load times, optimize power distribution, and ensure grid stability during periods of high demand. Additionally, the company can analyze historical consumption patterns to forecast future usage, identify trends in energy demand, and make informed decisions about resource allocation and infrastructure investments.
Infocion's Edge Visualization Solutions is more than just data presentation. It's about empowering action and unlocking the true potential of your edge data. Infocion's solutions transform your data into actionable insights, empowering informed decision-making and optimized edge operations.
Unlock the Power of Edge Visualization. Contact Infocion Today to Learn More!
Develop. Analyze. Automate.
Let's Talk!
Infocion's experts are here to discuss your needs and deliver tailored solutions in data engineering, advanced
analytics, and AI-driven applications. Get Started Today for Faster Results!